SCAN & PAINT 2D: HIGH SPATIAL RESOLUTION SOUND MAPPING
Sound source localization is an important topic in the field of sound & vibration, from product development stage to the end of line quality control.
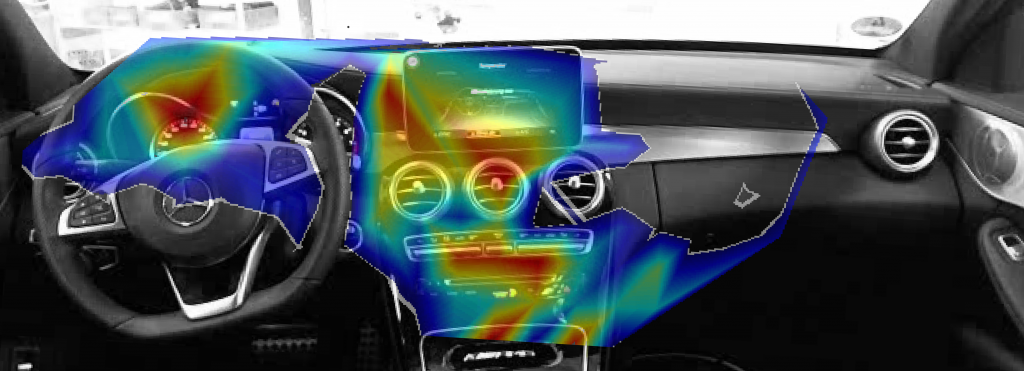
Scan & Paint 2D is a fast, easy and accurate tool to visualize stationary sound fields with an unmatched spatial resolution and in a broad acoustic bandwidth (20 Hz – 10 kHz). The system is a superb engineering tool for troubleshooting or benchmarking all kinds of objects on the spot. It only takes a few minutes to complete and entire measurement campaign.
Results of the scan are translated by the software into a color map, superimposed on a photograph of the measured object, allowing to find the origin of noise. Measurements with Scan & Paint 2D do not require anechoic conditions. In practice, there are many cases where placing a measured object inside of an anechoic chamber is not possible, for instance some large industrial machinery or a car interior. Scan & Paint 2D allows for direct measurement and visualization of particle velocity, which is not highly affected by background noise, or reflections. Moreover, sound intensity measurements can be taken even in situations with a high sound pressure to sound intensity ratio.
HOW DOES IT WORK?
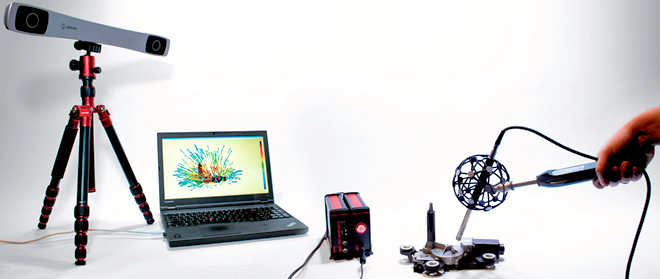
The Scan & Paint 2D measurement technique is a very simple and fast method. From system setup through data processing until data analysis, it only takes a few minutes and minimal equipment to complete an entire measurement campaign.
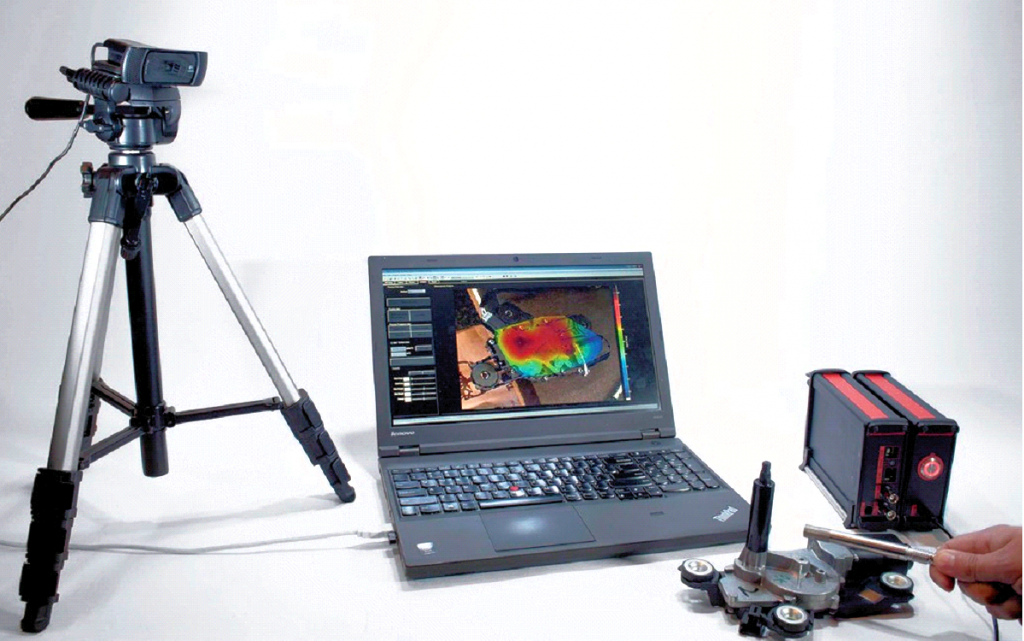
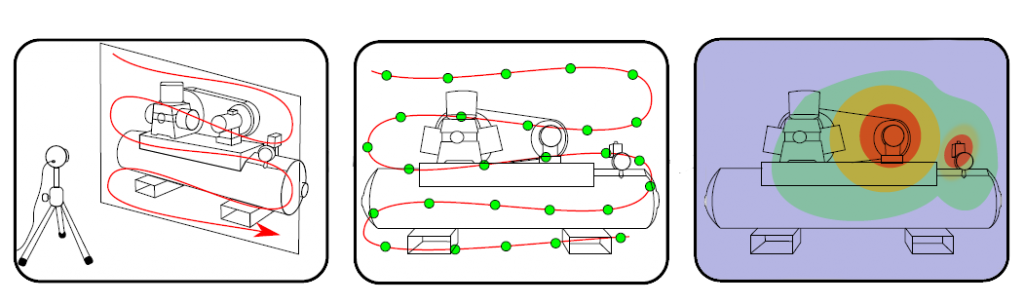
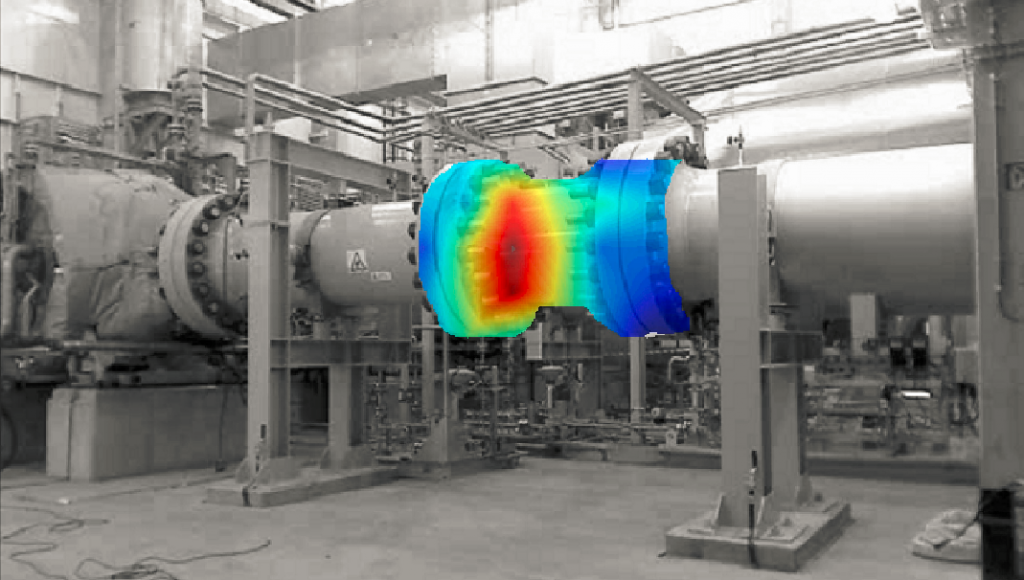
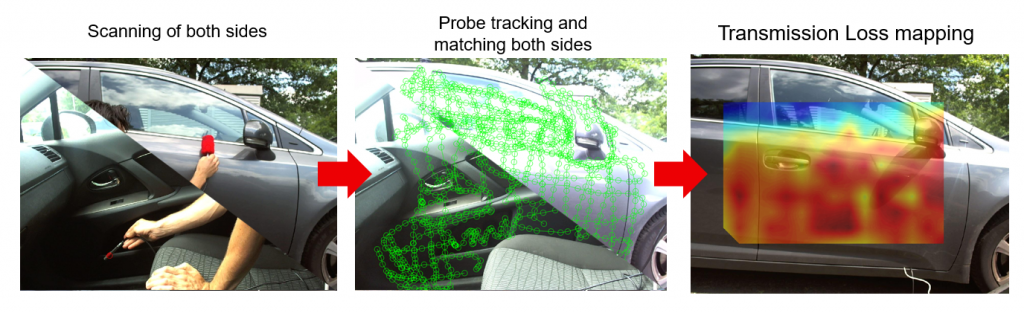
During a test, the surface of the sound source is scanned with one PU probe, while a USB camera films the scanning process. The recorded video and audio data are automatically synchronized by the Velo software. In the post-processing the position of the probe is extracted for each frame of the video. The auto-tracking function in the software automatically recognizes the probe along with its position by a color tracking algorithm. The particle velocity, sound intensity and sound pressure are calculated from the relative time block of audio data (relative to a particular location). A high resolution sound color map is produced as a result. With Scan & Paint 2D size doesn’t matter, you can measure anything from a small hearing aid to a large gas compressor.
Moreover a reference sensor can be added to preserve the relative phase for the measured particle velocity distribution. This feature enables to plot and study the dynamic behavior of the measured surfaces.
Scan & Paint is also a fantastic analysis tool when measuring flanking paths or isolation between rooms and barriers.
TYPICAL APPLICATIONS
- Sound field visualization
- Sound source localization
- Leak detection
- Troubleshooting
- Benchmarking
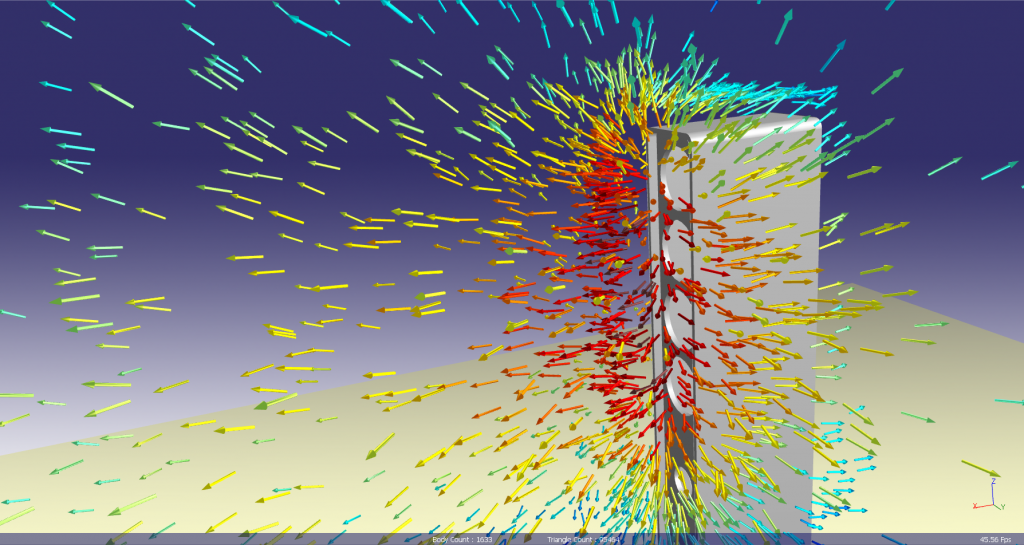
SCAN & PAINT 3D: SOUND VECTORS OVERLAID ON A 3D MODEL, IN JUST A FEW MINUTES
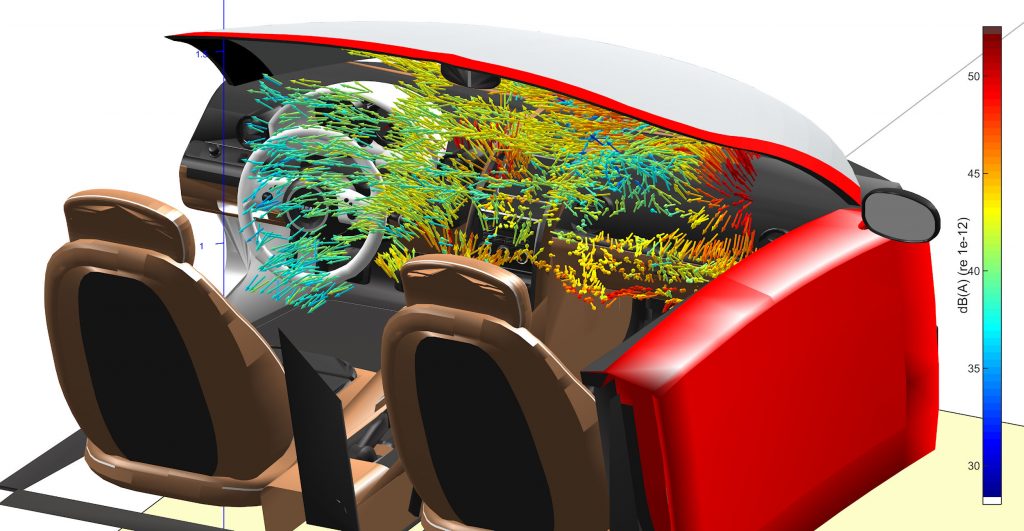
With Scan & Paint 3D it is now possible to localize your sound sources and visualize sound propagation in full 3D. In a matter of minutes the complete sound field, as 3D sound intensity or particle velocity vectors, is displayed on a 3D model.
A broad frequency range (20 Hz – 10 kHz) and an unparalleled dynamic range make Scan & Paint 3D a unique and powerful solution. The very small 3D sensor and the accurate real time 3D tracking of the sensor position, makes it possible to obtain results with a very high spatial resolution (up to 3mm). Allowing measurements on even very small objects. Additionally, an intuitive sound pow- er feature easily calculates the overall radiated sound power from the sound intensity data around your test object. Sound power measurements have never been easier.
HOW DOES IT WORK?
Scan & Paint 3D is equipped with a USP probe. This probe consists of three orthogonally positioned particle velocity sensors and one omni-directional microphone. Sound intensity can be obtained by taking the time averaged cross spectrum between the corresponding particle velocity sensor and the microphone. This enables to carry out measurements in a broad frequency range from 20 Hz till 10 kHz. The task of determining the position and orientation of the probe in space, is tackled with a stereo infra-red camera and a sphere with an asymmetric pattern of retro reflectors. Multiple measurements from different camera views can be merged into one full 3D project, providing you with maximum flexibility
Moreover, Microflown sensors enable to measure sound intensity measurements in environments with a high sound pressure over intensity ratio (P/I index). This unique feature makes the system a superb engineering tool for troubleshooting or benchmarking of all types of objects directly in-situ. The Scan & Paint 3D will allow you to locate sound sources even in acoustically challenging environments.
TYPICAL APPLICATIONS
- Noise source identification and ranking
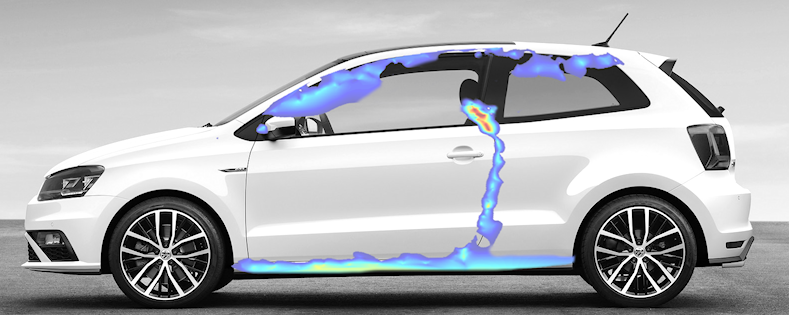
- Vehicle acoustics
- Powertrain
- Component testing
- Radiation patterns
Find more detailed information here.